AWS X-Ray
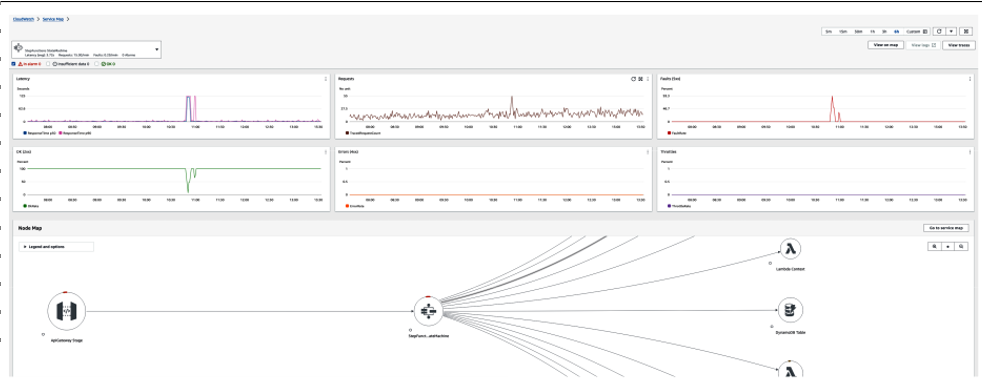
X-Ray is the native AWS solution for distributed tracing. It is a key component in the AWS observability stack and is fully integrated with the Amazon CloudWatch console. X-Ray provides tools to configure your application to collect trace data across owned and managed services. You can use the X-Ray console to analyze your traces and comprehensively understand the behavior and performance of your distributed services and system as a whole. You can also use the CloudWatch Service‐ Lens dashboard to get an overview of your trace data and the services that have been traced through (see Figure 8-5).

Figure 8-5. The Amazon CloudWatch ServiceLens dashboard
The ServiceLens dashboard is often a good place to start when trying to pinpoint performance issues before diving deeper into an individual trace or group of traces to identify patterns that point to a root cause (later, we’ll talk more about using the core analysis loop to debug issues).
It’s important to note that trace data is only retained for a maxi‐ mum of 30 days. Traces can also only be retrieved via the X-Ray console for periods of up to 6 hours. This means that if you need to analyze traces over, say, a 12-hour period, you’ll need to perform two searches and aggregate the results yourself. Traces are therefore primarily useful for debugging immediate and recent production issues. Metrics, logs, and other application data should be used to build up a retrospective picture of your system’s behavior beyond 30 days in the past or across longer continuous periods of time.
The following is a list of the high-level components of a trace:
Segments
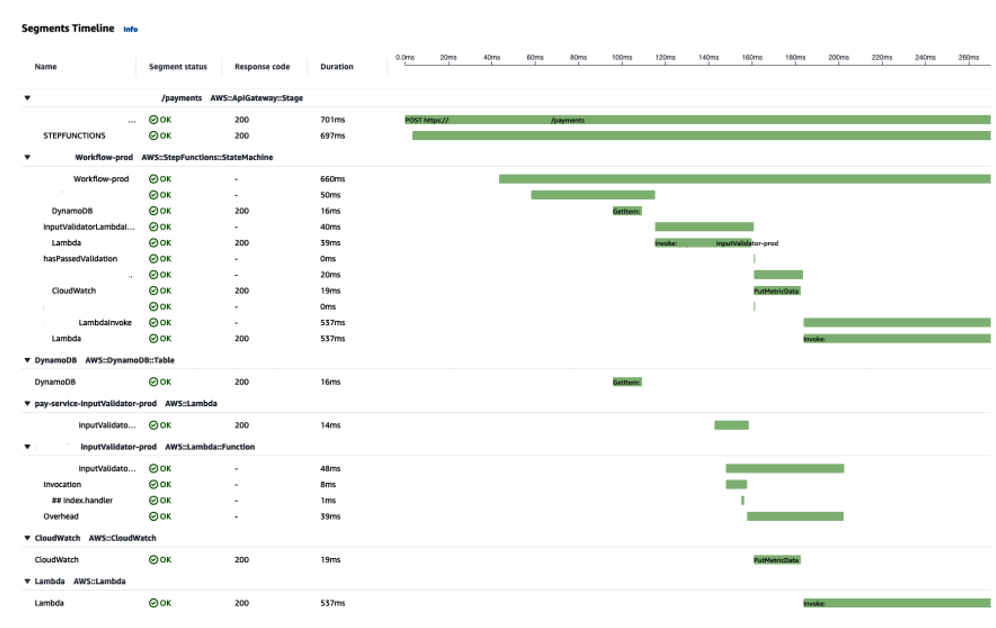
A trace is a collection of segments that are generated by a single request, such as calling an API Gateway REST endpoint or invoking a Lambda function. The trace data in a segment will include details such as the request URL and method and the HTTP response code, as well as the total duration of the request (see Figure 8-6).

Figure 8-6. X-Ray segments timeline
Subsegments
The work performed during a segment is split into subsegments. For example, for a segment generated by a Step Functions state machine execution, each step or task would be represented by a subsegment. The same information is available as for a segment, just at a more granular level.
Annotations
Annotations are key/value pairs that can be added to your traces to augment the default data that is included by the X-Ray SDK. Annotations are indexed by X-Ray, allowing you to filter and group traces based on the annotation data. You can add up to 50 annotations per trace. For more information about annotations, see “Annotation” on page 365.
Metadata
Metadata can be attached to your traces to provide additional context when analyzing trace data. Use metadata to record data you want to store in the trace but don’t need to use for searching traces.
Exceptions
An exception is recorded in a trace if an error occurs during an instrumented request. In this case, the trace will include details about the exception, including the error message and stack trace if available.
To begin collecting traces of transactions across your serverless application, you must focus on two things: instrumentation and annotation. We’ll dive into these building blocks in the following sections.
Usage of the X-Ray service is priced based on the number of traces recorded and retrieved (via the AWS Console, CLI, or SDK). The Free Tier includes 100,000 traces and 1,000,000 retrievals for free, at the time of writing (see Chapter 9 for more details on the AWS Free Tier).
If you are generating and analyzing a greater volume of traces than this, you should set a sampling rate based on the cost you are willing to incur. X-Ray uses your sampling rate to decide what percentage of requests to record. For example, you might consider a sampling rate of 100% when launching a new service to capture as much data as possible. This rate can then be reduced over time as you begin to fully understand the service’s behavior and can better anticipate its failure modes.
