Instrumentation
Instrumentation is the process of configuring the microservices and managed services in your system to emit trace data when making API calls and performing tasks. For managed services, API calls are instrumented via the configuration of the resources you create. For example, to enable tracing for a Step Functions workflow you would include this configuration in your CloudFormation template (see Chapter 6 for more information about CloudFormation):
{
“Type”: “AWS::StepFunctions::StateMachine”,
“Properties”: {
“TracingConfiguration”: {
“Enabled”: true
}
}
}
You will also need to attach an IAM policy to the role used by the resource to allow it to write to X-Ray. This is generally the same policy regardless of the managed service or resource. For example:
{
“Version”: “2012-10-17”,
“Statement”: [
{
“Effect”: “Allow”,
“Action”: [
“xray:PutTraceSegments”,
“xray:PutTelemetryRecords”,
“xray:GetSamplingRules”,
“xray:GetSamplingTargets”
],
“Resource”: [
“*”
]
}
]
}
Instrumenting your serverless microservices will typically involve using the X-Ray SDK from your Lambda functions. The AWS Powertools toolkits are the best way to do this (see Chapter 6 for full details). By instrumenting your Lambda functions, you can collect trace data about operations such as AWS SDK calls and third-party HTTP requests.
Annotation
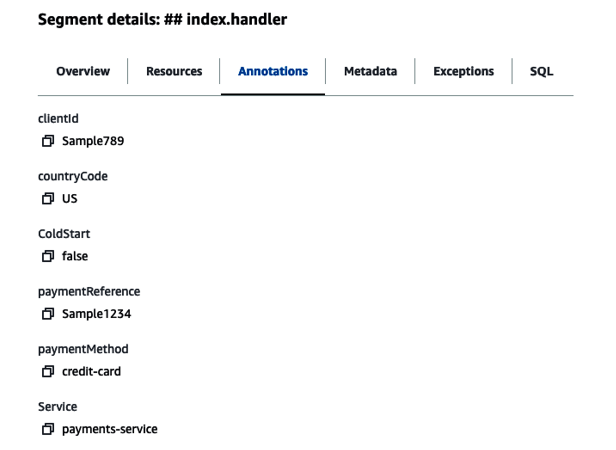
Annotations are the key to building an effective collection of traces that can be used for rapid debugging of production issues. The X-Ray SDK will collect core data about the requests and responses your application makes, such as the name of the service or managed resource and the duration of the request, but annotations allow you to augment the default trace data with application state and transaction-specific information.
Annotations can be added to the segments and subsegments of your traces as your application code is executed. All annotations are indexed by X-Ray and can then be used to filter your traces when trying to understand how your application is currently behaving. See Figure 8-7 for an example.
Distinct traces can be correlated across services, including across first- and third-party systems, by using a common correlation ID. You can use a dedicated correlation ID, but the primary identifier of transactions in your application will typically suffice, as this is likely to be present in most of the events that occur. For example, in an order management service this might be the order ID.
Your correlation ID should be added to the annotations of every segment of your trace to ensure it can be used to accurately group and filter traces across your system.

Figure 8-7. X-Ray segment with annotations
You can create trace groups to store a common set of queries your team may need to run to filter traces. You can create up to 25 trace groups per account.
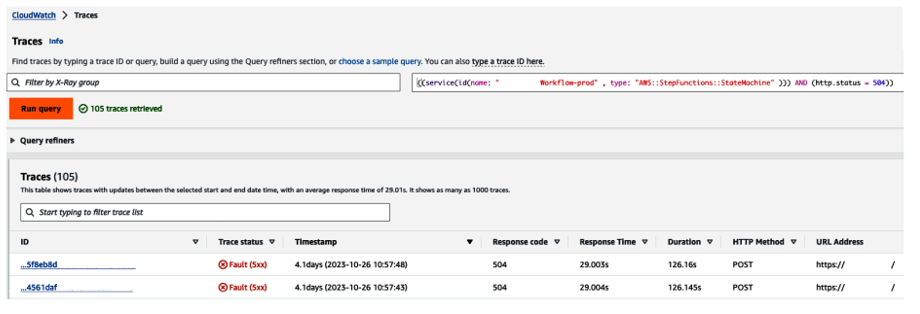
In the event of a critical error occurring in your production workload, you can combine the default trace data and your custom annotations to filter traces that point to the root cause via the X-Ray console. Figure 8-8 shows an example of how this can be achieved.

Figure 8-8. Using the X-Ray console to filtertraces with erroneous HTTP response codes on a specific node
Figure 8-9 shows how exceptions can then be surfaced from trace data to facilitate rapid debugging and accurately pinpoint the root cause of a production issue.

Figure 8-9. X-Ray segments timeline with exception
Next, let’s look into what happens when an error occurs in your application and how you can write code that is tolerant of faults.
